

なかなか興味深い記事を見つけました。
S&P 500 Price Change Frequency Distributions | Seeking Alpha
https://seekingalpha.com/article/168445-s-and-p-500-price-change-frequency-distributions
これによると、過去60年間のデータにおける1日の変動の分布は、
平均 0.0325%
標準偏差は 0.9650%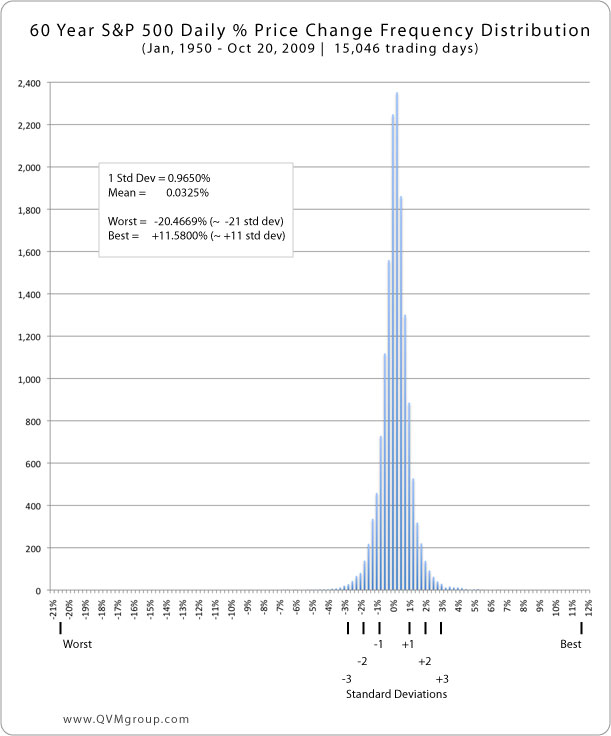
1ヶ月の変動の分布は、
平均 0.67%
標準偏差 4.19%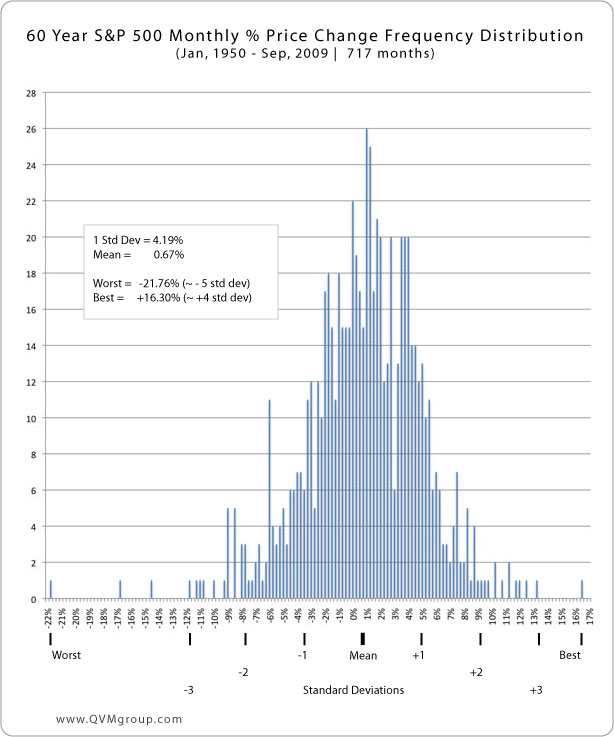
最後に年間の変動の分布は、
平均 8.02%
標準偏差 15.74%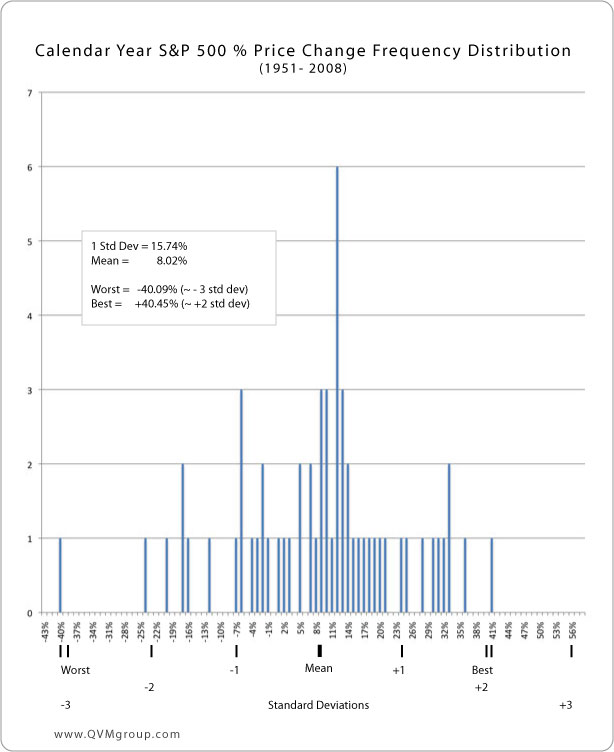
とのこと。これを元にリスクや期待利益の計算をするのも良いかも。
Add new comment